

Technical Charting Free app for iPhone and iPad
4.8 (
9858 ratings )
Finance
Developer: Chris Werner
Free
Current version: 1.0, last update: 6 years agoFirst release : 02 Jan 2013
App size: 800.64 Kb
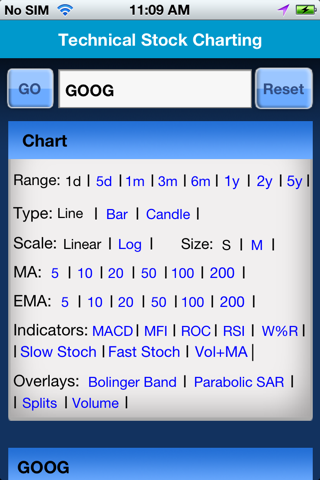
The chart analysis combines the popular technical indicators MACD, Moving Averages, Stochastic, RSI (Relative Strength Index), various volume oscillators, Money Flow Index, Rate of Change, Volume with Moving Average, Williams Percent Range, Bollinger Bands, Parabolic Stop and Reverse, Splits.
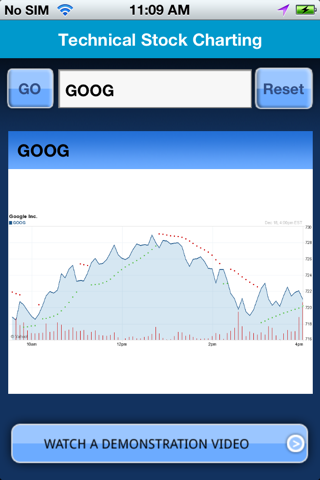
Chart mid and long-term stock technical analysis based on recent price trend, volume and volatility.
KEY FEATURES
-Date range 1 day to 5 years
-Line, Bar and Candle charts
-Linear and Log scaling
-Small or Mid-Size charts
-Moving Averages
-Exponential Moving Averages
-Nine technical indicators
-Four overlays